
A $4.7 million instructional budget, planned once instead of twice
The Situation
Every year, the Science Division at UC Santa Cruz decides what it will teach: 1,062 courses across Fall, Winter and Spring, about 240 instructors, roughly 150 teaching assistants holding more than 690 appointments, and an instructional support budget of about $4.7 million that has to cover all of it.
That planning ran on spreadsheets. Each department kept its own, then entered the same information again into a larger divisional workbook. When a teaching assignment, a faculty leave or a funding assumption changed, staff updated it in both places and reconciled the versions. “If something changes, we have to update it in two places,” says Patti Schell, the division’s Operations Manager.
The workbook also had to be rebuilt every year. Before planning could begin, someone reworked the formulas and scripts underneath it, which made it hard to carry assumptions forward or see how a change in faculty availability would play out in later years. None of that was anyone’s mistake. A spreadsheet holds one year in one shape, and the division needed several of each.
What Changed
Beezwax built the division a shared planning system, and this fall its department managers and administrative staff, about fifteen people, are moving onto it, starting with a small group. Departments will maintain their teaching assignments, leaves and staffing plans directly, and the division will review the same records instead of consolidating submissions. A change gets made once.
The system understands the division’s work. It knows what a cross-listed course is, that two instructors can share one course, and that a TA on a cross-listed course is paid by one department while teaching under two subject codes. Those rules live in the software rather than in the memory of whoever is doing the entering.
The main planning view puts Fall, Winter and Spring side by side, because that is how the division already thinks about a year. Each department sees every course with its instructor, cost, TAs and enrollment, plus who is on leave each term, with the totals for the year running across the top.
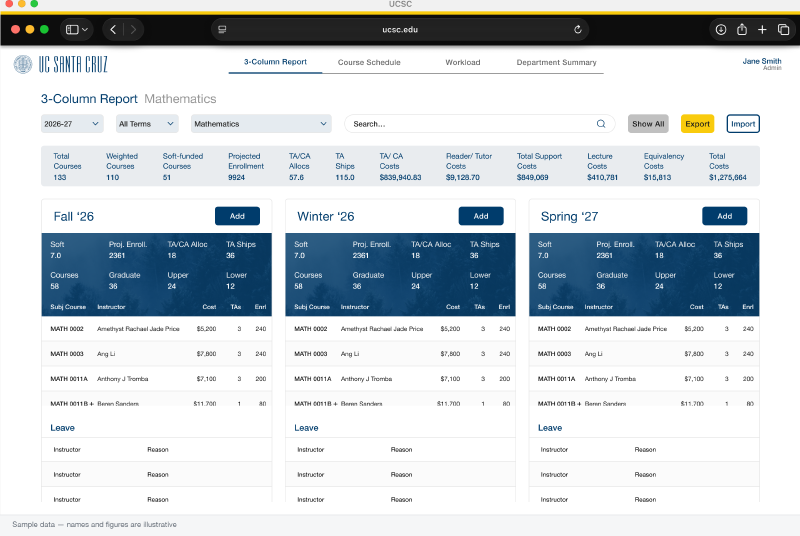
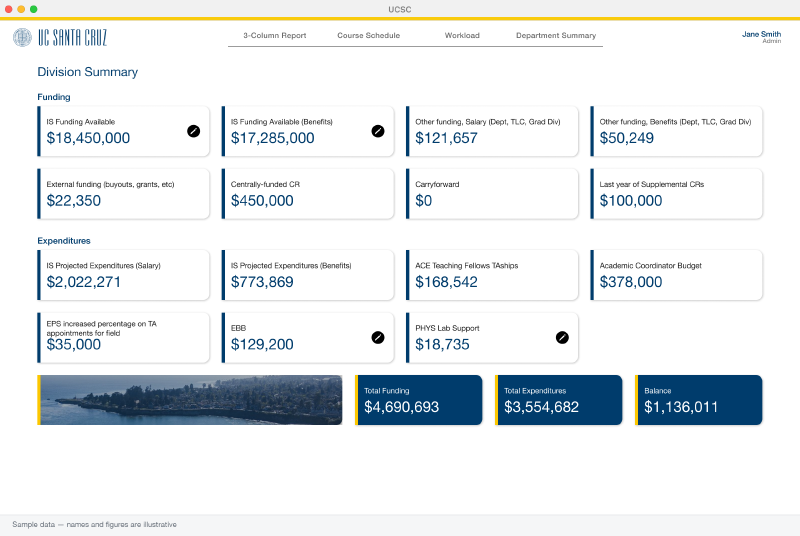
Dashboards replace the hunt through tabs. The Division Summary puts funding, projected expenditures and the remaining balance on one screen, so it is easier to spot gaps and see what a change does to the budget. Plans carry forward from year to year, so next year starts from this year’s work instead of a rebuilt workbook. Every change is recorded with who made it and when, and the division can take a snapshot when the numbers need to hold still. Accessibility was a requirement from the first design file, not a retrofit.
The division is already planning what comes next: TA resource management and scheduling, built on the same planning information rather than another separate process.
This will allow us to spend less time consolidating and checking data and more time using it to make decisions. That is especially valuable as staffing and budgets become more constrained.
How it was built
For readers who want the engineering detail.
React and Next.js over Postgres, in a strictly layered architecture: server actions validate input, services hold the business rules, and every database query lives in a repository behind them. The audit trail is captured by Postgres triggers rather than application code, so nothing writes without leaving a record. Tests run against an in-memory Postgres, so schema changes surface before they ship. The application deploys in containers to staging and production, behind campus single sign-on, with role-based access scoped by department. Interface components are built on accessible primitives to a WCAG 2.1 AA standard.
Beezwax built it with agentic development, six months from spec to soft launch, faster than a conventional build of this scope would have allowed. That speed went into shipping more of the division’s planning workflow rather than less.